


FarmQA Analytics
Get the most out of your agronomic data with FarmQA Analytics.
FarmQA Analytics is a powerful tool that automates the process of data analysis. Use FarmQA Analytics to compile, analyze, and display the data you collect in the field as it comes in or after.
Track the metrics that matter to you the most
Avoid the hassle of manually compiling your data. Define metrics for data that FarmQA will track from submitted scouting reports or uploaded map layers. Summarize insect pressure data as it comes in real-time from the field, or compile a whole season's worth of NDVI data with the push of a button.
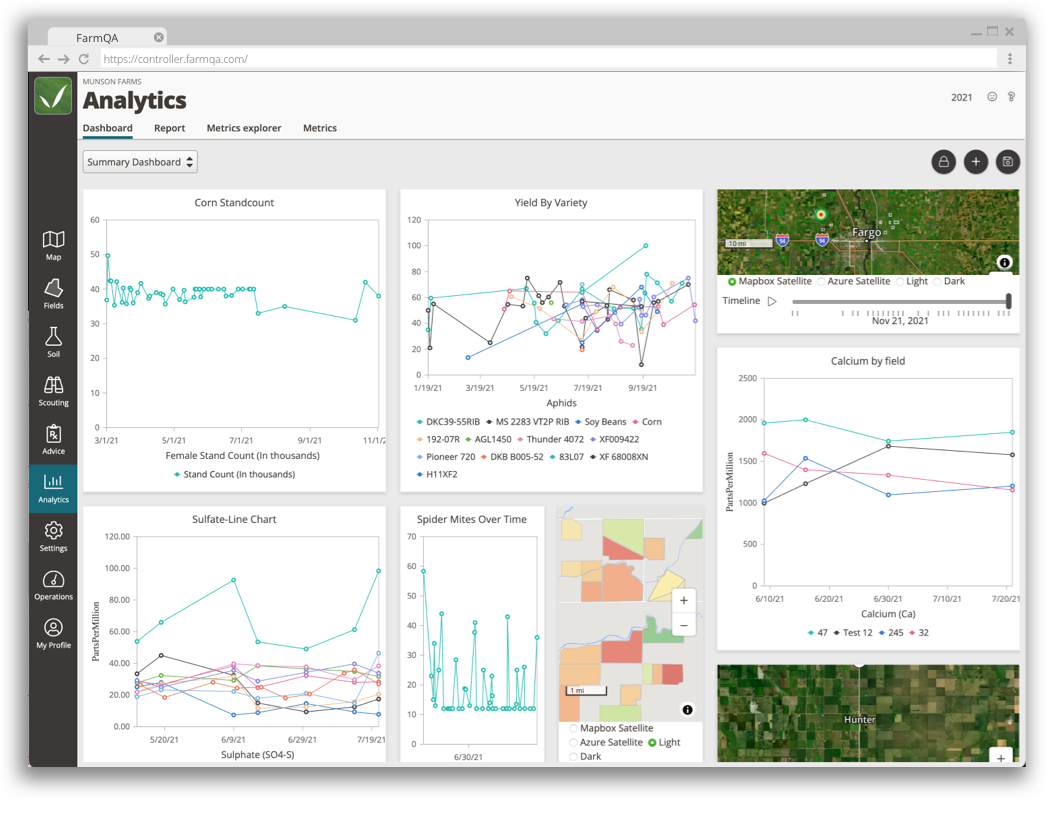
Access your data visualizations from the dashboard
Keep all of your data visualizations in one convenient place. Show all of the key performance indicators for you and your growers on your FarmQA dashboard. Click on specific fields or points to see detailed data from the fully functional charts and maps.
With Analytics, I get a good picture of the number of aphids, for example, and whether they’re going up or down. And how that compares between growers. By looking at the trends, I have a good idea of whether I need to intervene or whether the problem will likely resolve itself. Read more
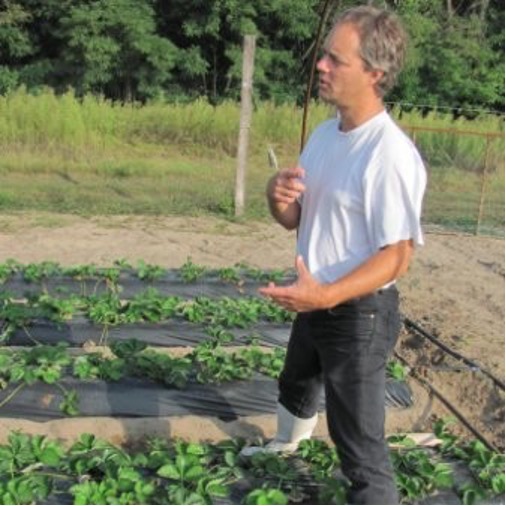
Klaas Plas, Agriculture consultant and strawberry specialist, Berry Konsult, Netherlands
You decide how you want to visualize your data
FarmQA's metric explorer gives you the power to convert your metric datasets into meaningful data visualizations. Create heat maps, line graphs, and bar charts to glean insights from your agronomic data. You can also set the time frame for which you want data visualized. Gain insights from data coming in from the field today or identify trends happening over the entire growing season.
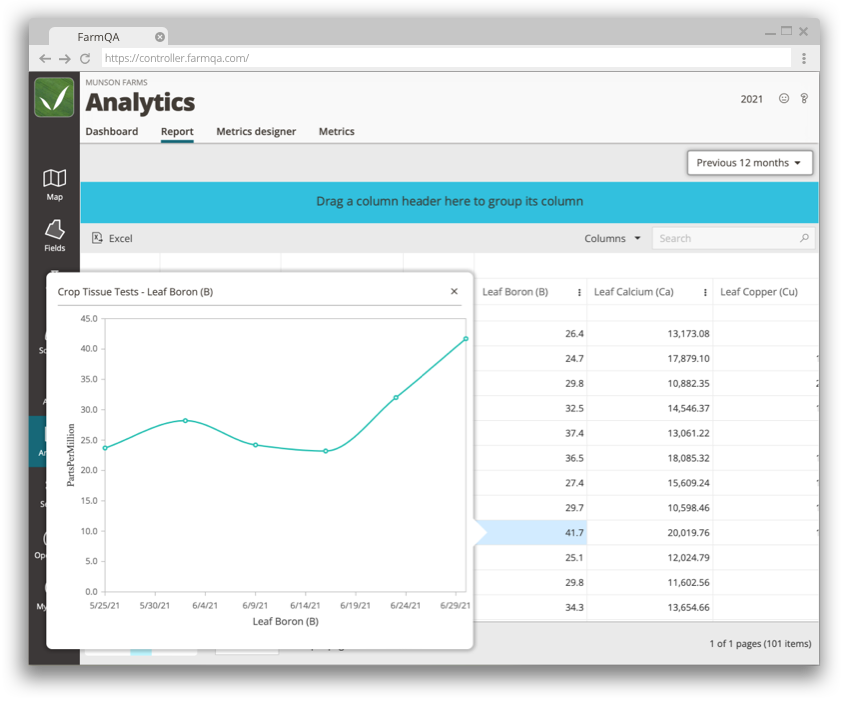
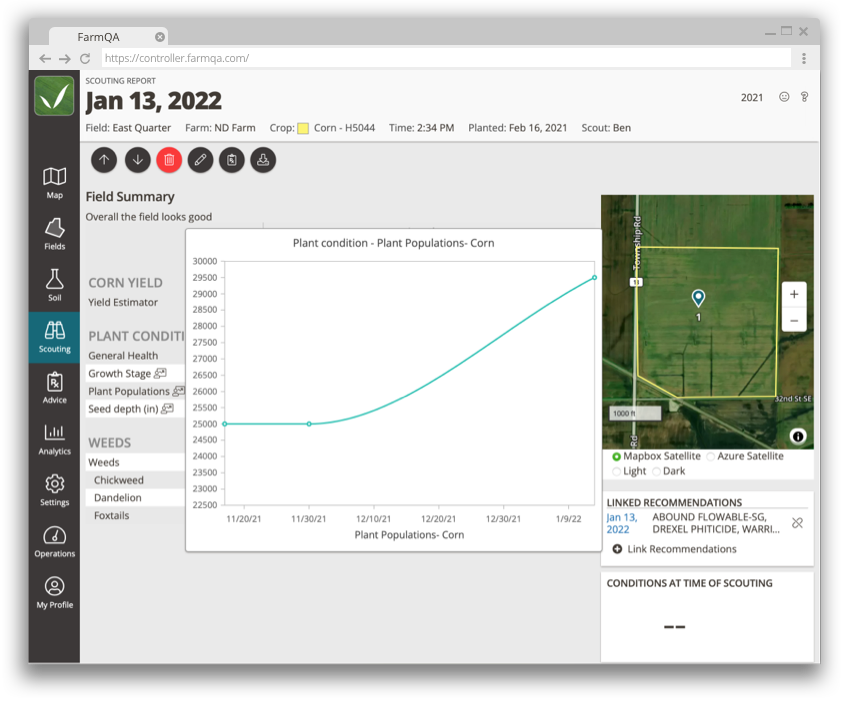
Access metrics outside of Analytics
Analyzed metrics don't just live within the FarmQA Analytics tab. You can view a metric from a scouting report where an observation for that metric was made to compare values in that report for season-wide trends. Metrics for an individual field can be accessed simply by clicking on the field in the map tab to get a closer look at what's happening in your operation.
Watch the Analytics Webinar
Watch the Analytics Webinar to learn more about the features of FarmQA Analytics. You can also read more about FarmQA Analytics in our blog.
Ready to try FarmQA Analytics?
Sign up for a free 14-day trial of FarmQA to see what FarmQA can do for you and your crop consulting business.
Sign up for FarmQA