


Introducing Map Layers in FarmQA
I wanted to share an early look at a feature that we're hard at work on — Map layers. The Map layers capability allows advanced spatial layer visualizations within FarmQA. You can easily import spatial data layers into FarmQA generated from other precision ag tools, then view the visualizations in FarmQA on the web and in our mobile app.
Map layers provide more information on your customer's fields, especially while you are out in the field. You can define a map layer for scouting locations or define one that has the latest NDVI imagery via Planet integration. With all of the data available in one place, you will have more of the data that you need to diagnose problem fields.
Layer set up
We've organized map layers as an enterprise-level concept. In Settings, there is a new tab called Map layers. On this page, you create layers that will be used globally throughout the fields that you manage. Read our support article for more information on creating map layers. FarmQA supports the following types of layers:
Permanent — A permanent layer is a layer that persists over time on the field. A very cool feature of this type of layer is that all images added to a field are shown at the same time. This allows you to construct some interesting maps. The trick to layering, at this time, is to remember that we render the images in alphabetic order.
Growing season — A growing season layer allows the capture of growing season-specific information about a field. Like a permanent layer, multiple images are displayed all at the same time when this layer is active.
Time-based layer — When a time-based layer is active, a timeline slider is displayed on the map letting showing you the images associated with the layer within that time range.
Image Acquisition
Now that we have layers defined. We can add images to a field. We can source images in a couple of different ways. Here is a list of some of the image sources we can process, but it isn't an exhaustive list.
- GK Technology — Images created and processed in GK Tech are immediately importable into FarmQA layers.
- John Deere — You may have to do some processing, but the Shapefiles produced by John Deere Operations Center can be uploaded easily into FarmQA.
- QGIS — Using QGIS is a great way to make yourself insane, but offers great abilities to completely customize how you view the data. To get the data from QGIS into FarmQA, export as a Shapefile or as a GeoJSON.
- Google Earth Pro — Google Earth Pro is a great way to get almost any image to display as an overlay. With Google Earth Pro you can create a new image layer, position it correctly over your field and then export to KMZ or KML and import.
- GeoJSON — Many tools will export or save in GeoJSON format. FarmQA can easily import these files as well.
Importing raster images
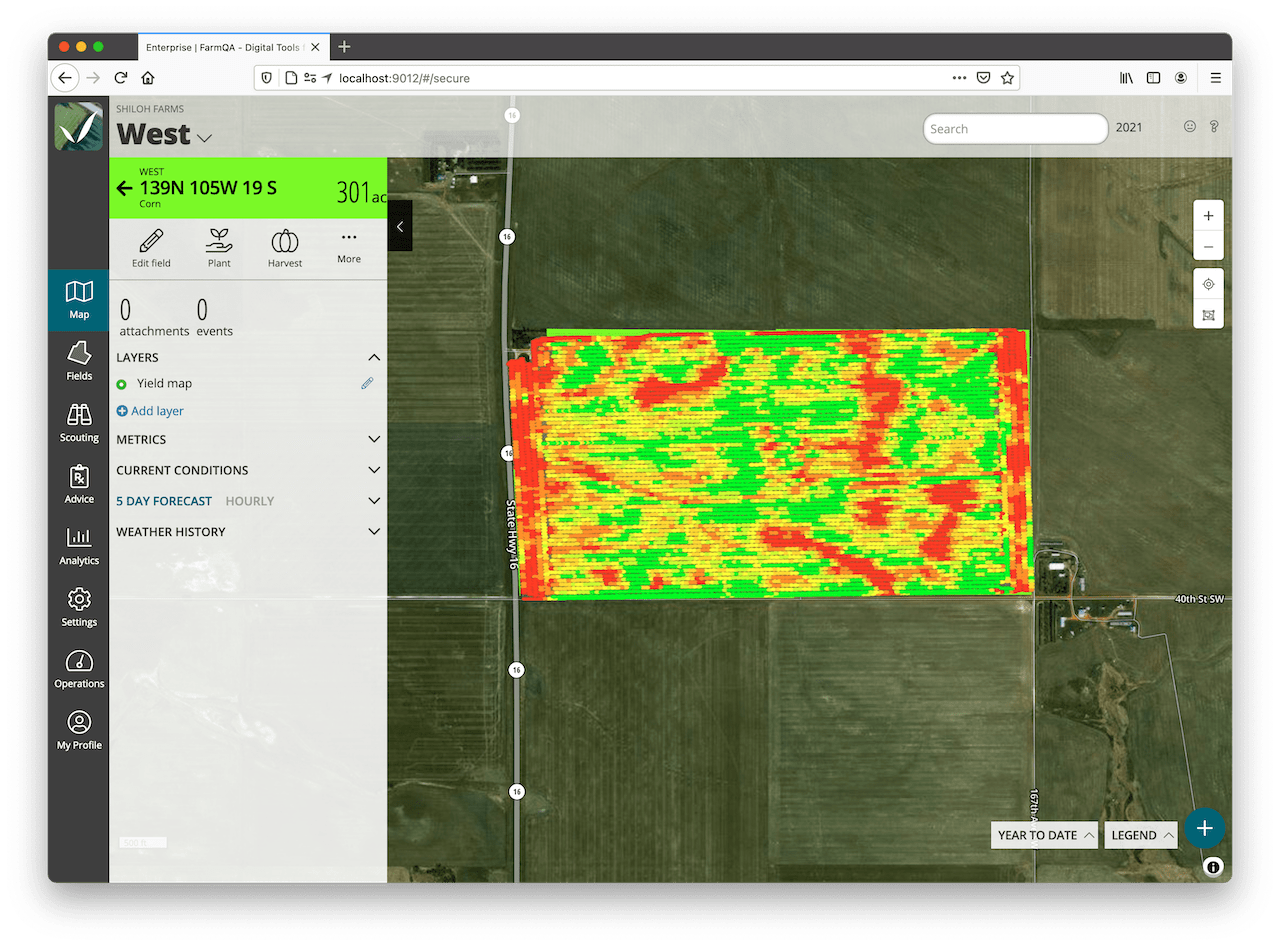
Once you have an image in the format you want it is very easy to add to FarmQA. Simply select the correct field, in the field summary pane, expand Layers, then click Add layer. Choose the correct layer, then either drag the image to the pane or click the button to upload.
The image that I chose to upload was a yield map (observant readers will note that it wasn't actually for this field) and I added images to a growing season layer called Yield map which I defined as a growing season layer. This is an example of a bitmap or raster image.
Importing vector images
Importing a vector image is a bit more interesting. Vector images can have a mix of points, lines, and polygons plus data. This file contains points and lines that were drawn in Google Earth.
        {
            "type": "Feature",
            "properties": {
                "Name": "Scouting Path",
                "description": null,
            },
            "geometry": {
                "type": "LineString",
                "coordinates": [
                    [
                        -103.935270095826297,
                        46.703045795853512,
                        0.0
                    ],
                    ....
                ]
            }
        }
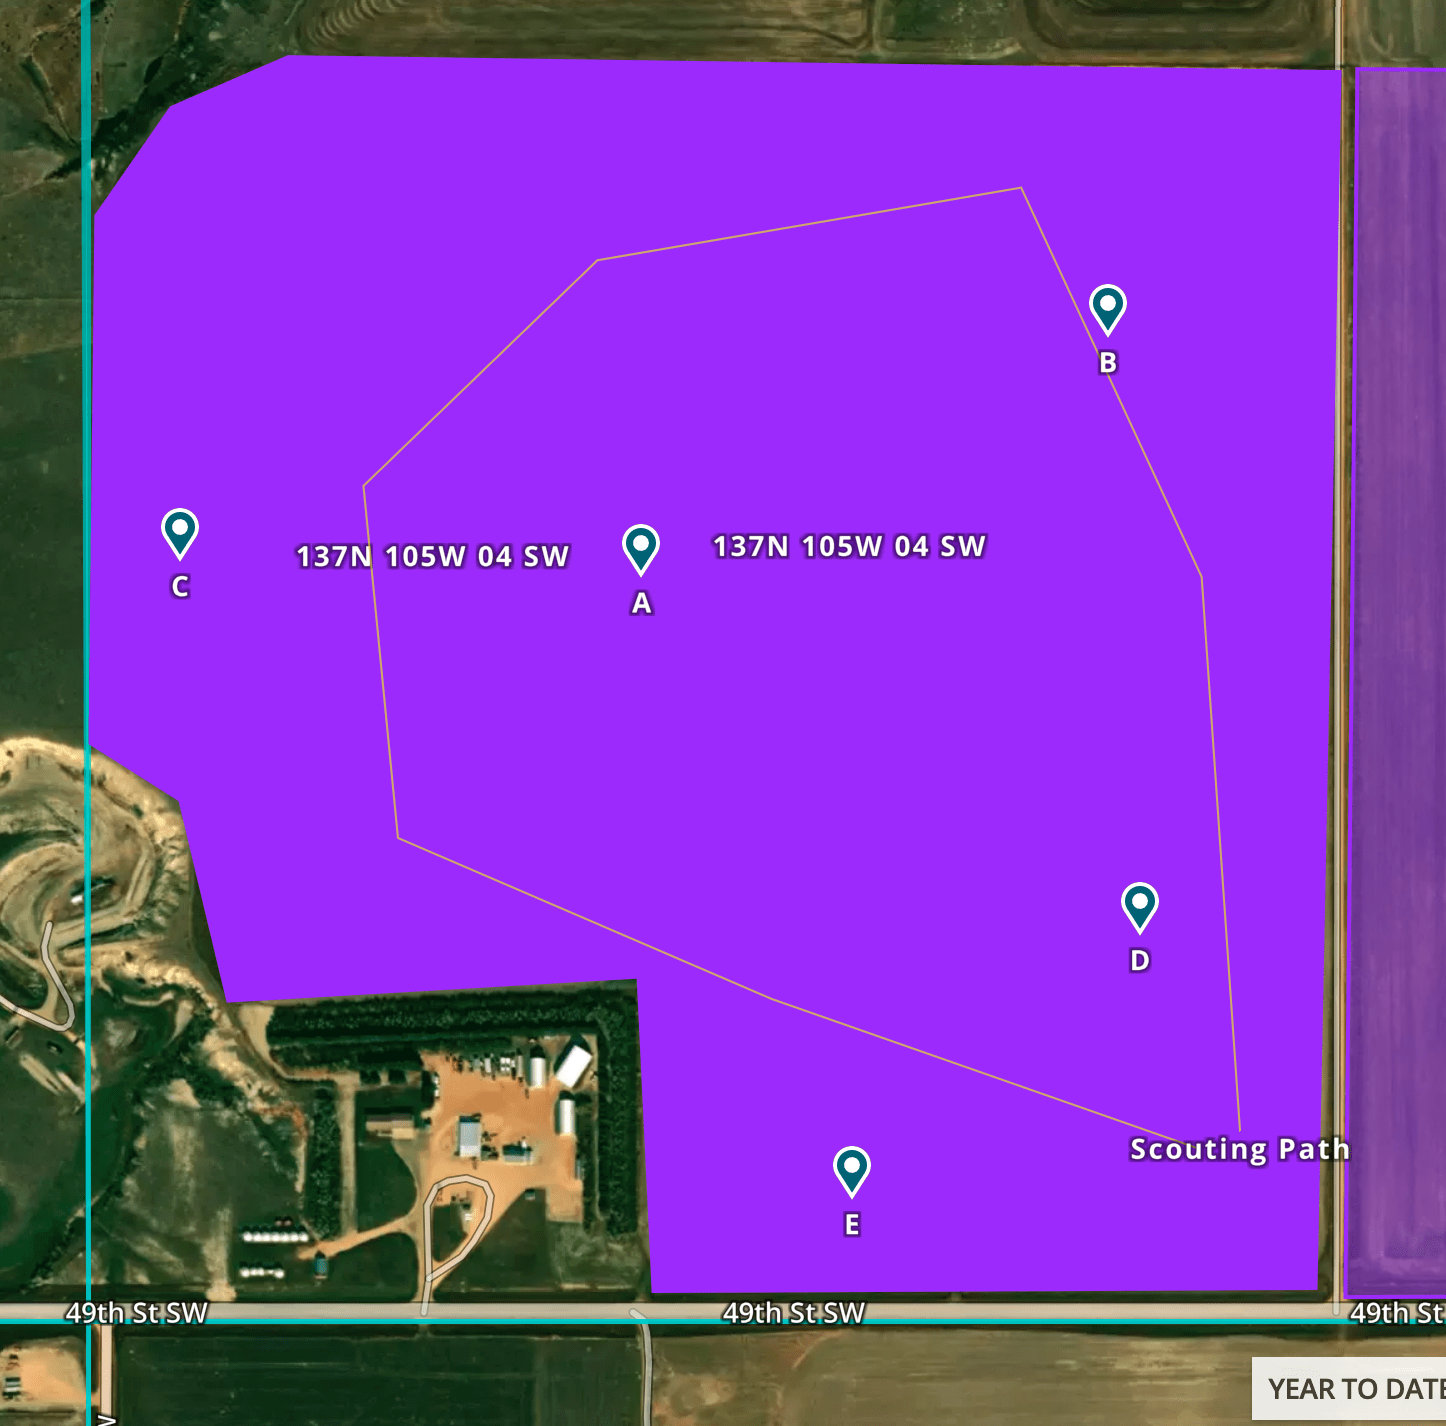
The first feature in this file is the line string. This is a pretty basic line and has the label "Scouting Path". The next features in this file look similar to this:
        {
            "type": "Feature",
            "properties": {
                "Name": "A",
            },
            "geometry": {
                "type": "Point",
                "coordinates": [
                    -103.938213889630305,
                    46.702697496367492,
                    0.0
                ]
            }
        }
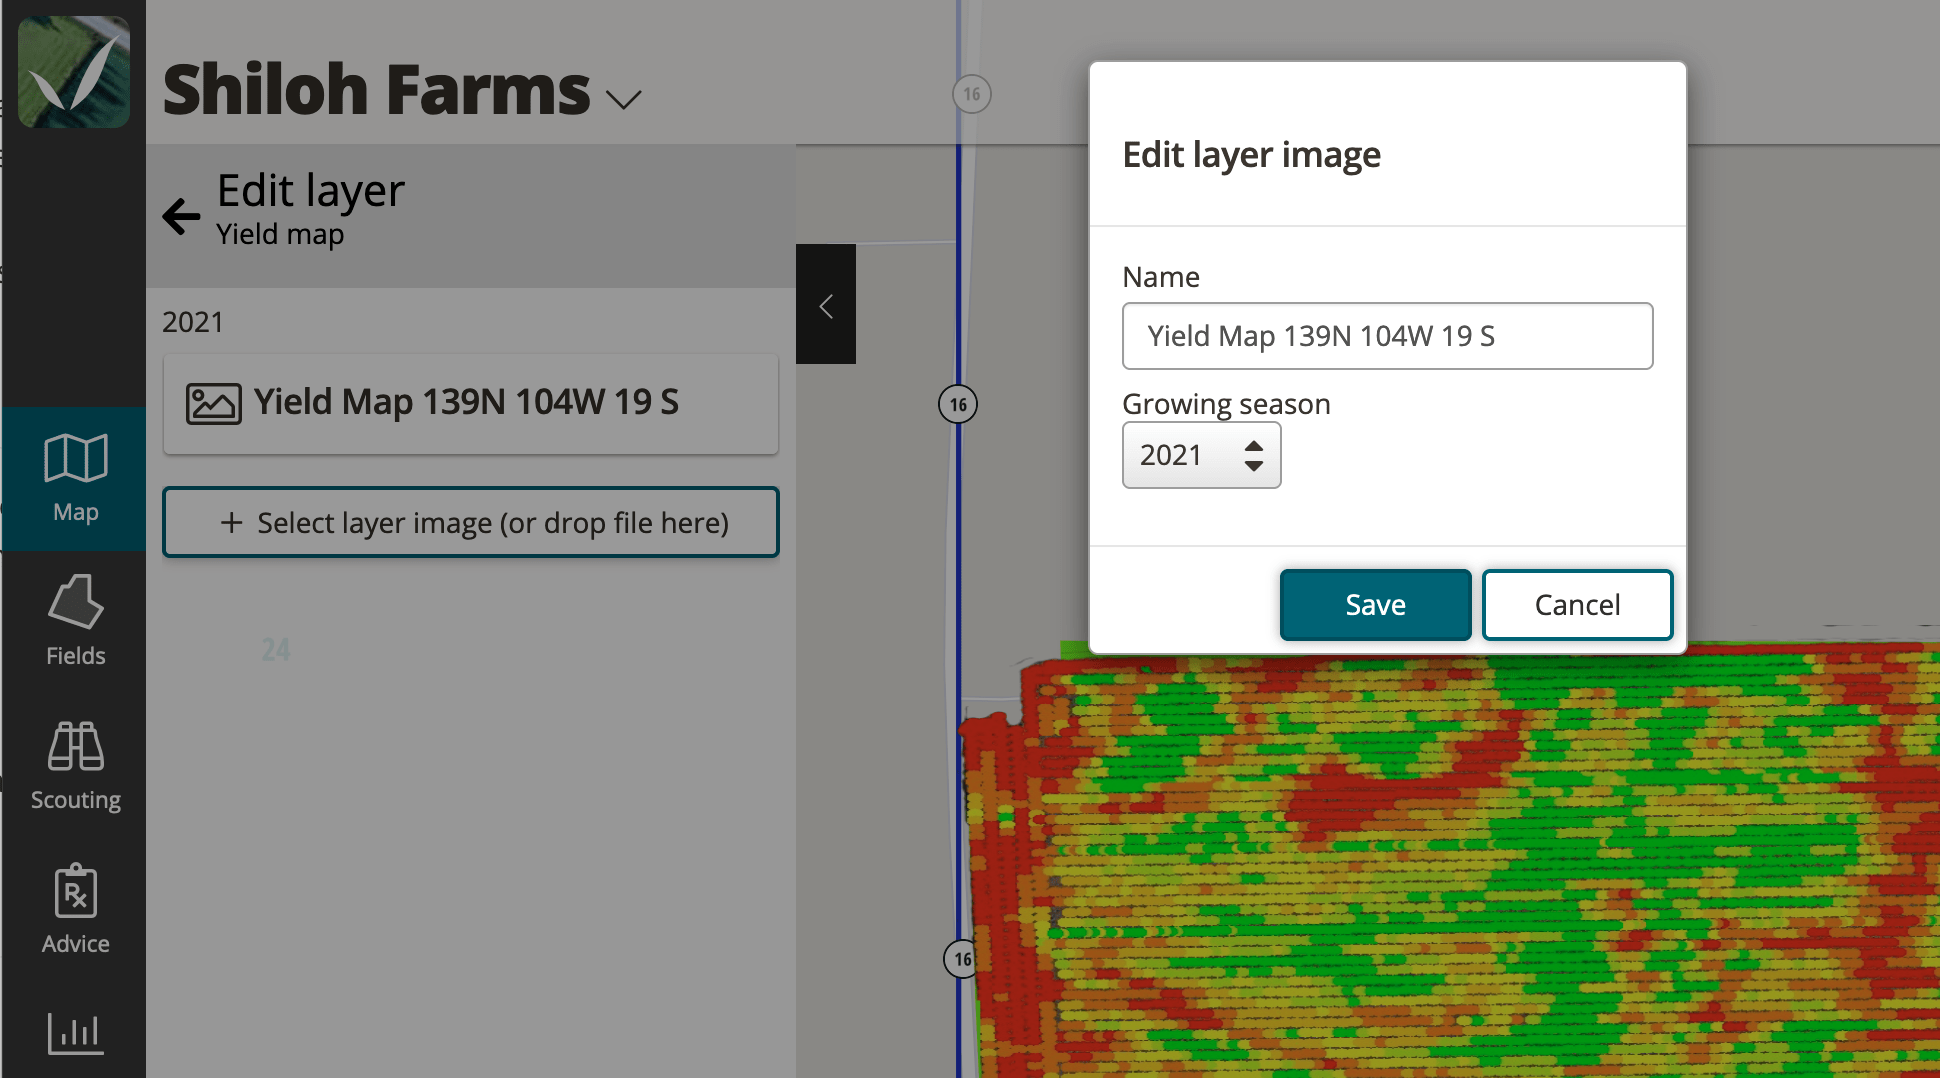
This defines a point and each of the points has a label. When we import this into FarmQA we have a couple of options. After adding the image to an appropriate layer for the field, click the Edit button. There are more choices now because this is a vector file and we can do a bit more to style the elements within.
The first styling we're going to do is to change the color of the line. Under the Line tab, we're going to turn on Show labels and pick the Name attribute. Under style, we're going to leave it as a Single color but we'll pick a nice color that will contrast well.
For the Point elements, turn on Show labels and choose the Name attribute. Also, turn on both Allow overlap and Show icon. The result looks like this:
Polygon vector images
Vectors with polygons are a lot more interesting and the styling options are more plentiful. Again, to illustrate this, I'm using a file that was originally produced by GK Technologies, but that I've converted to GeoJSON using QGIS. The GeoJSON looks like this:
        {
            "type": "Feature",
            "properties": {
                "ZoneID": 1,
                "GV-Zones 2": 48.778,
                "hslColor": "hsl(0, 100%, 50%)",
                "Hexcolor": "#ffffcc",
                "Funcolors": "red"
            },
            "geometry": {
                "type": "MultiPolygon",
                "coordinates": [ ... ]
            }
        }
This GeoJSON file has 7 features. Each feature has a ZoneID, GV-Zones 2, and several color attributes. If you have a vector file that has the color already encoded into the attribute table, we support the specification of color in several formats. The attribute Funcolors shows support for named colors. We also support HSL colors as illustrated by the hslColor attribute. By far the most common specification for colors is found in the Hexcolor attribute.
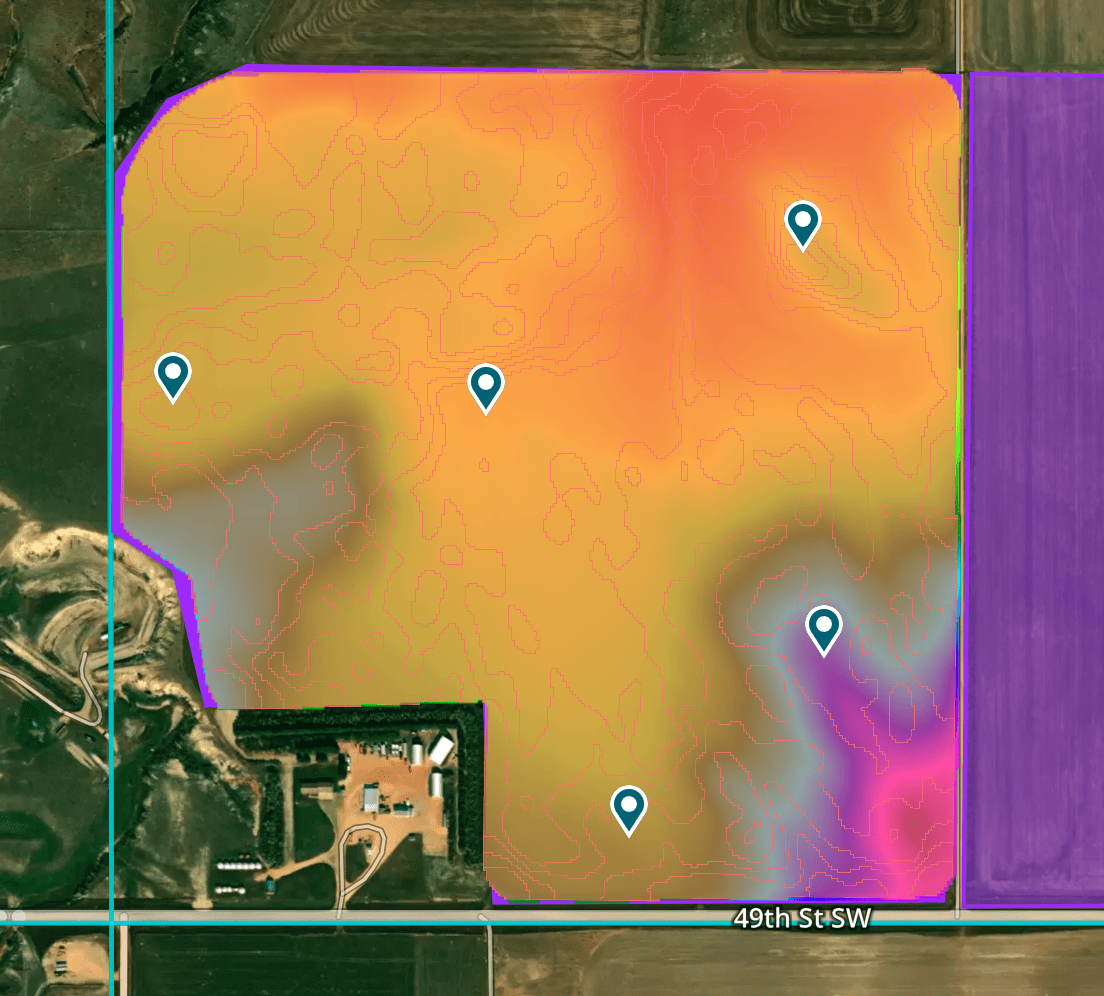
After importing this layer, we can now edit the styling. The first thing we can do is turn on labels. In this case, we're going to use the ZoneID attribute. Now let's switch from showing displaying a single color for the whole image to use an Attribute embedded in the file. Choose this option now let's choose which attribute we want to use to color the features in this vector image. Shown below is what this layer looks like with all 3 of the attributes applied.
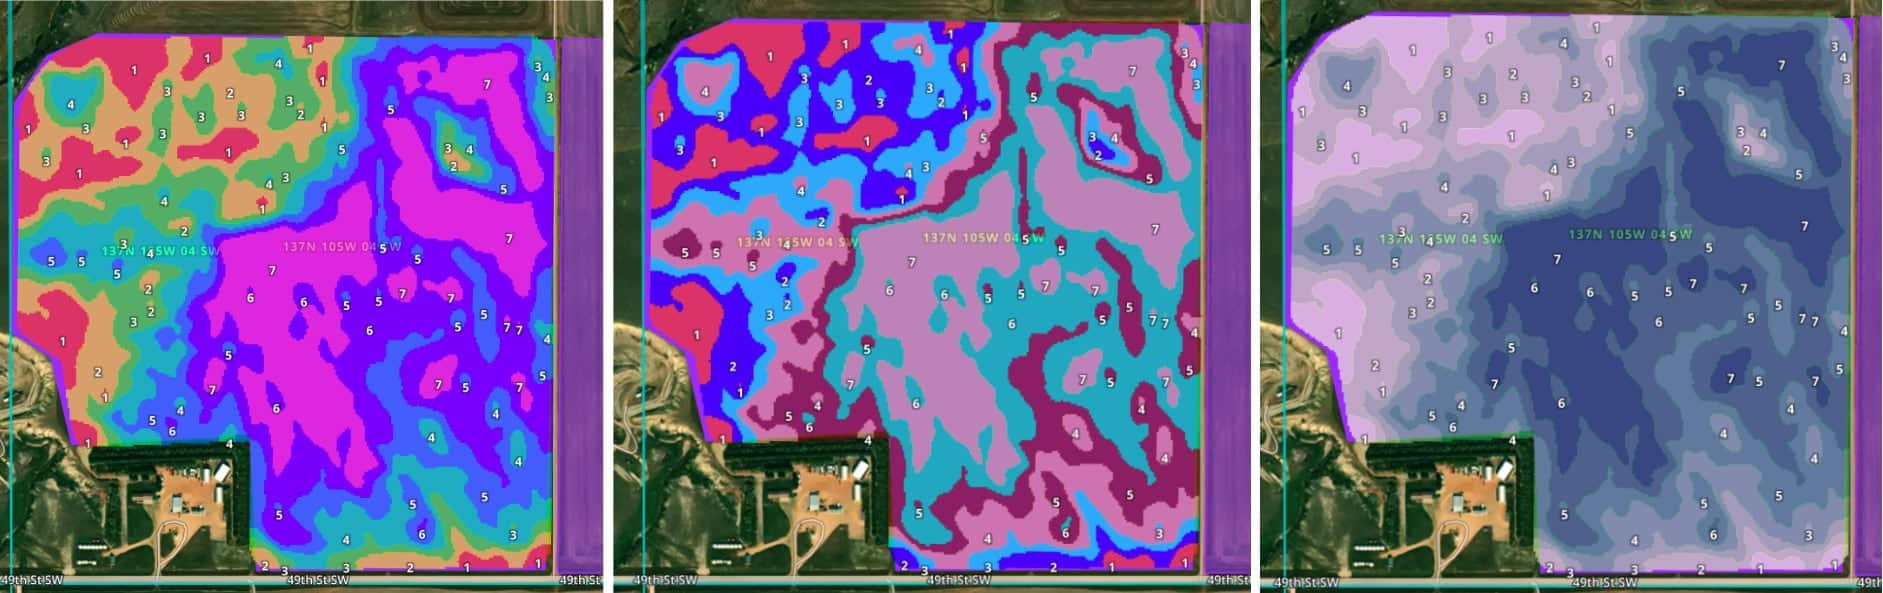
But what if the vector layer doesn't have embedded colors? That is easy. In the style editor choose Custom and now you choose an attribute from the file to match and provide a color to render it with. In the case of this file, I set the attribute to ZoneID and then set the colors based on the values.
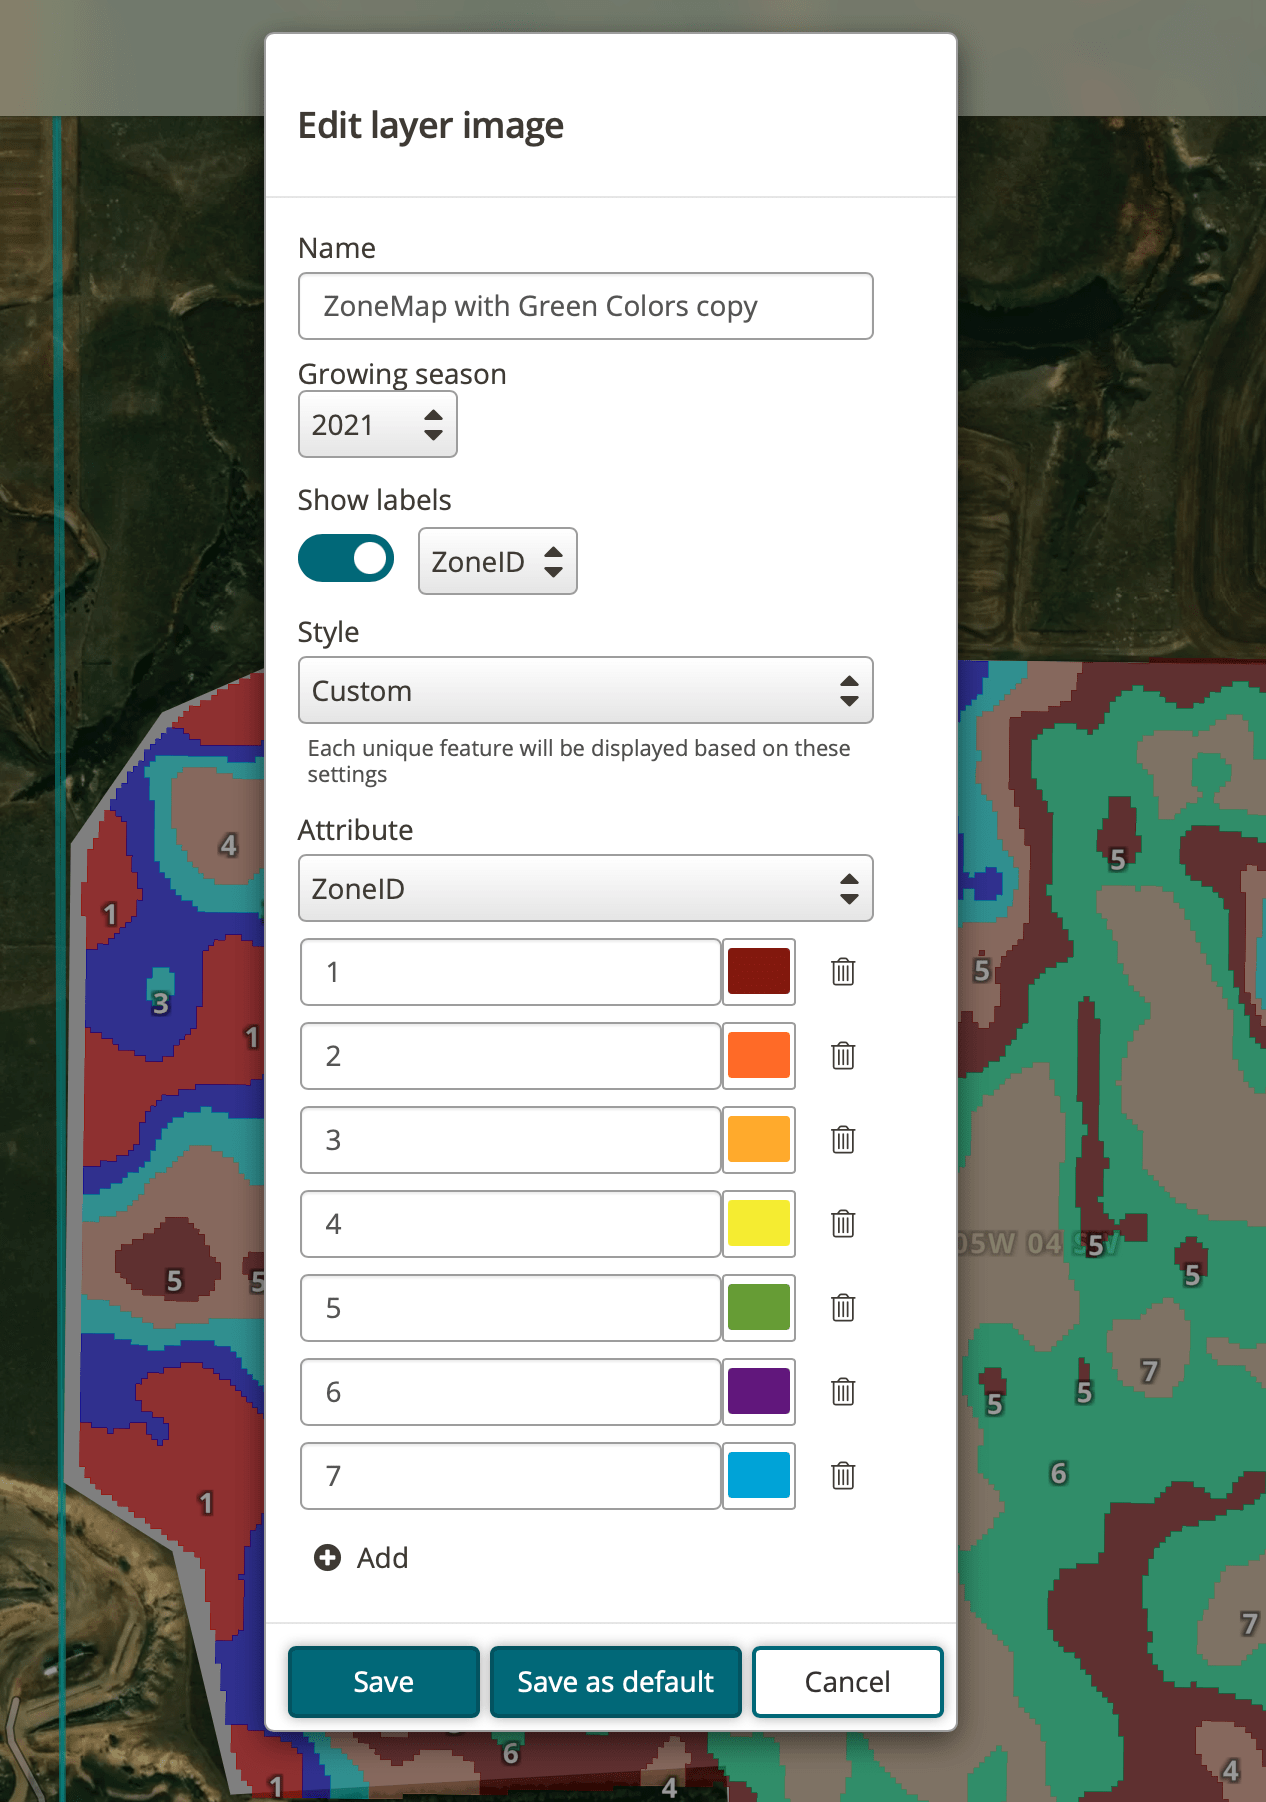
Also, at the time of this writing, we're working on an enhancement to automatically assign colors to features.
Finally, if you save any of these as the default for the layer which means that each image you upload will follow the same styling.
Mobile
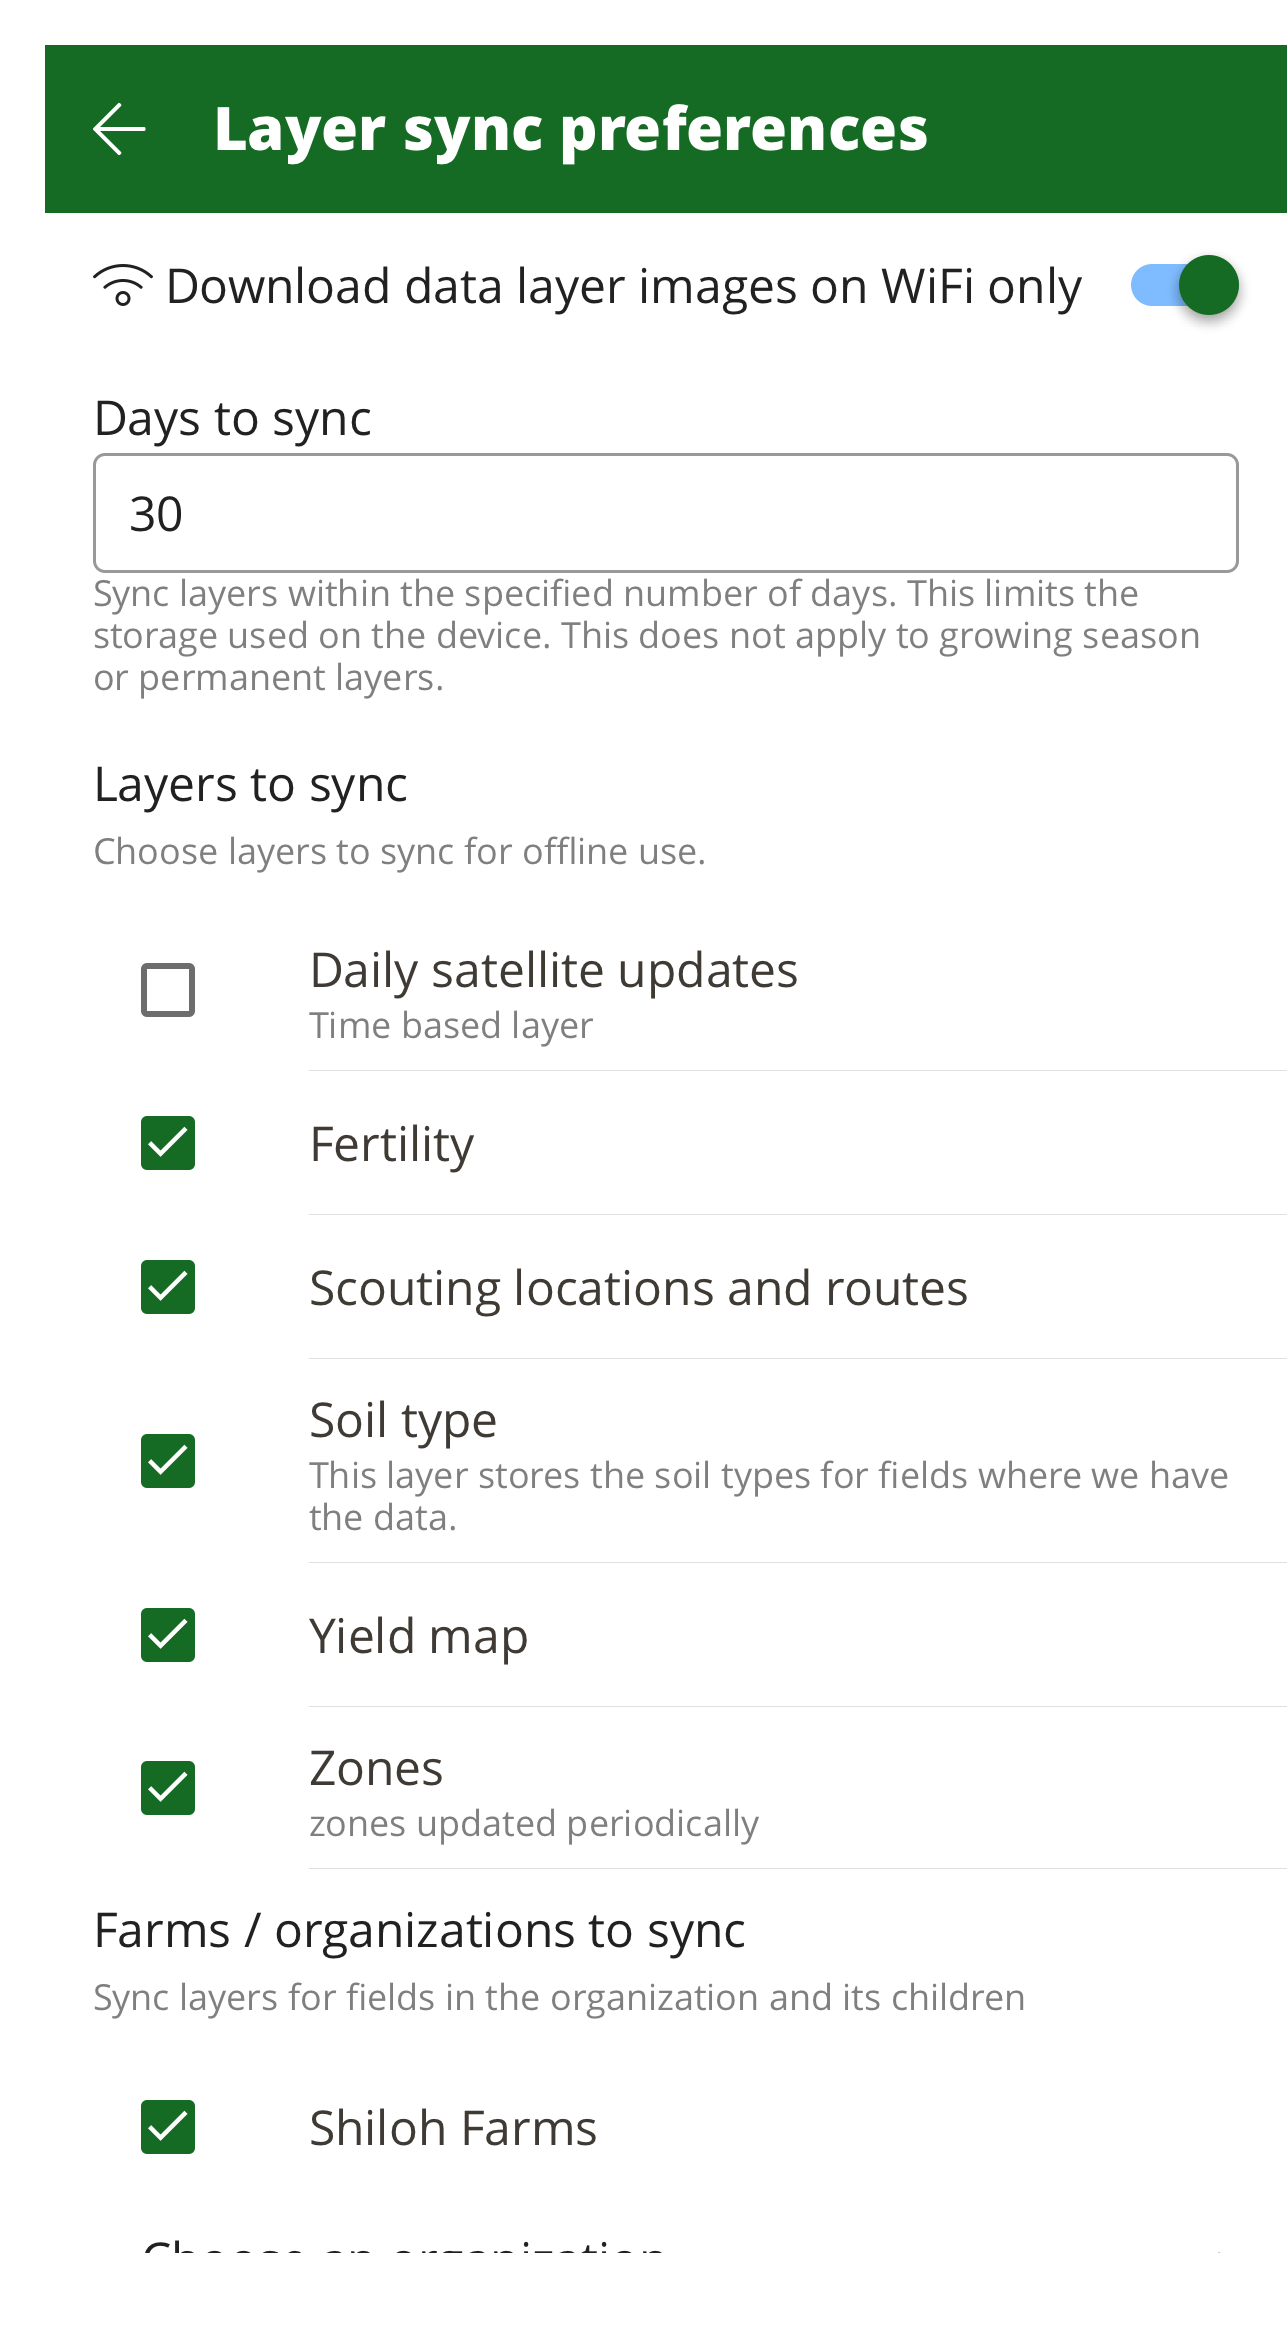
This brings us to our mobile client, FarmQA Scouting (yes, it is so much more than scouting.) Map layers are available in our mobile client but you must specifically specify your preferences for syncing. Choosing Settings in the bottom tab, do an initial sync, then choose Sync preferences. On this page, you can choose the specific layers you want to sync as well as which organizations you want to sync.
After you sync, simply go to any of the fields you a layer image for, and drag the drawer up to see the layers. We're going to be adding more functionality in the future to this drawer, so watch this blog for more information on new features to be added.
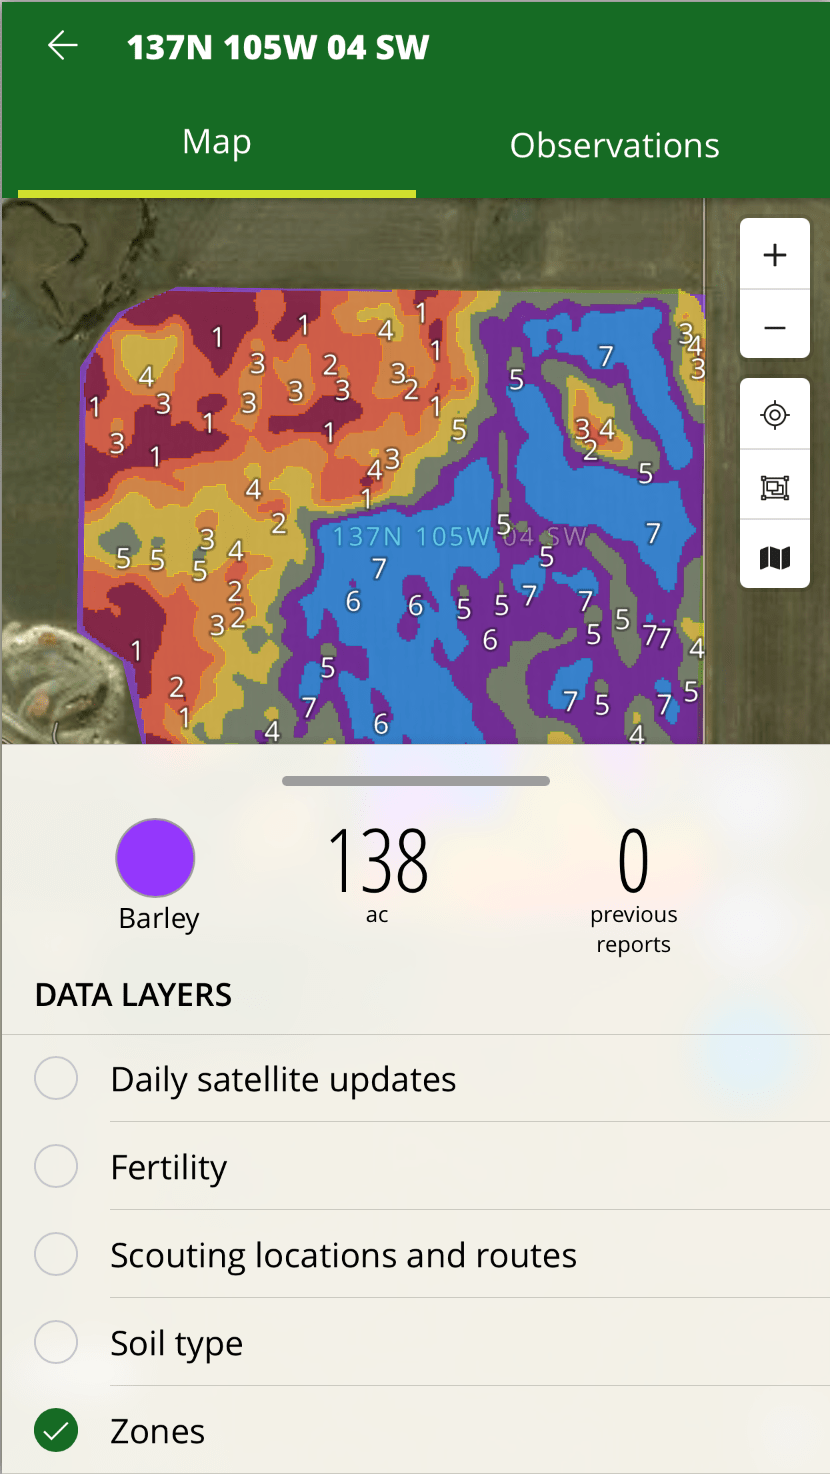
Map layers are available online and offline.
For the latest information on viewing map layers, consult our support article on viewing map layers.
Wrapping it up
Thanks for bearing with me on a huge blog article. I wanted to make sure that everyone was up to speed on the new spatial data layer functionality that is coming soon to FarmQA.